Foreign Investment in France
The Annual Report on Foreign Investment in France published by Business France in 2025 confirms France’s position as a major destination for foreign businesses.
In a nutshell
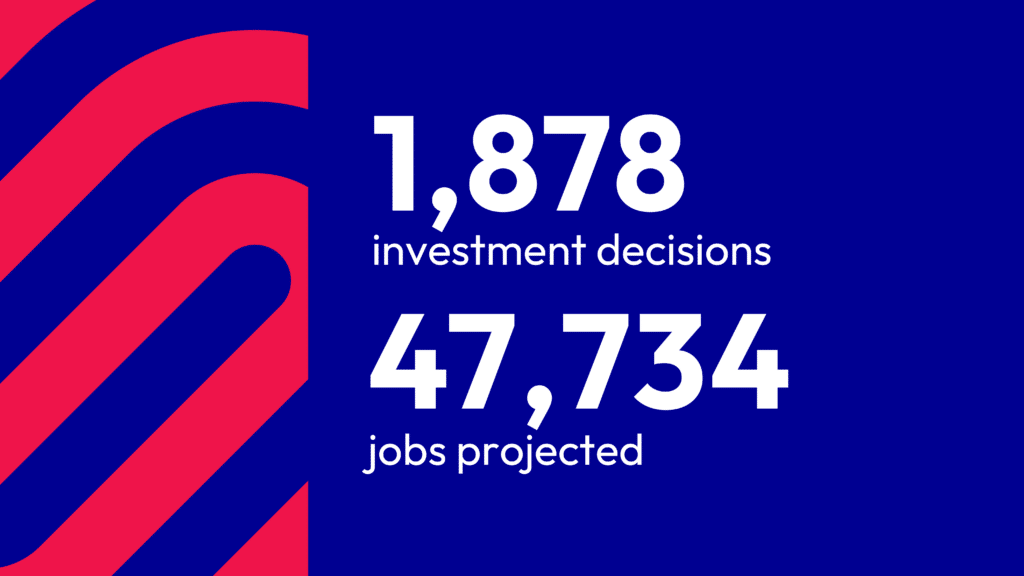
- In 2025, France recorded 1,878 foreign investment decisions.
- These projects accounted for 47,734 jobs created or maintained nationwide.
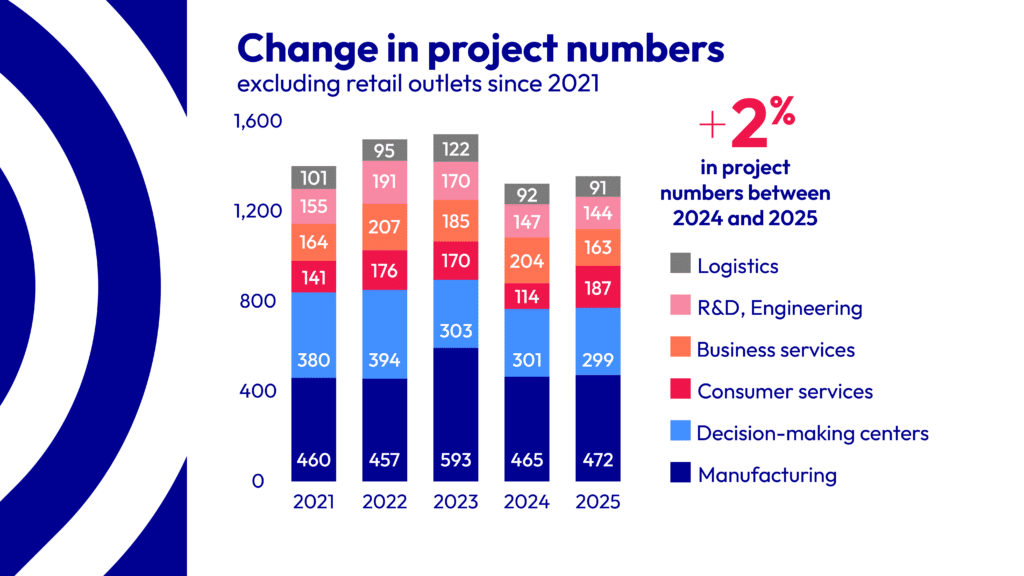
- Excluding new retail outlet openings, the number of projects increased by +2% compared with 2024, confirming a stable dynamic.
- Industry remains at the heart of France’s attractiveness, with more than 800 industrial projects identified.
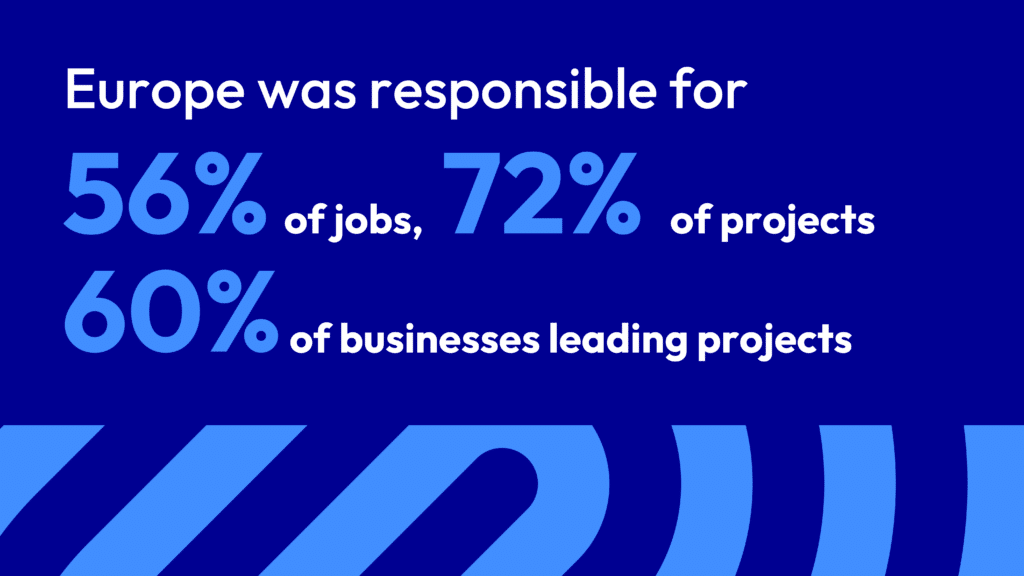
- 72% of investments came from Europe, which remained the leading source region for projects in France.
The investment dynamic in France
In 2025, France recorded 1,878 foreign investment decisions, accounting for 47,734 jobs created or maintained nationwide. A total of 1,021 foreign businesses were behind these decisions, illustrating the diversity of international interest in the country. One-third of the projects were led by new foreign businesses in France. Excluding new retail outlet openings, the number of projects increased by +2% compared with 2024, confirming a structural dynamic.
- 800+ industrial projects, at the heart of reindustrialization.
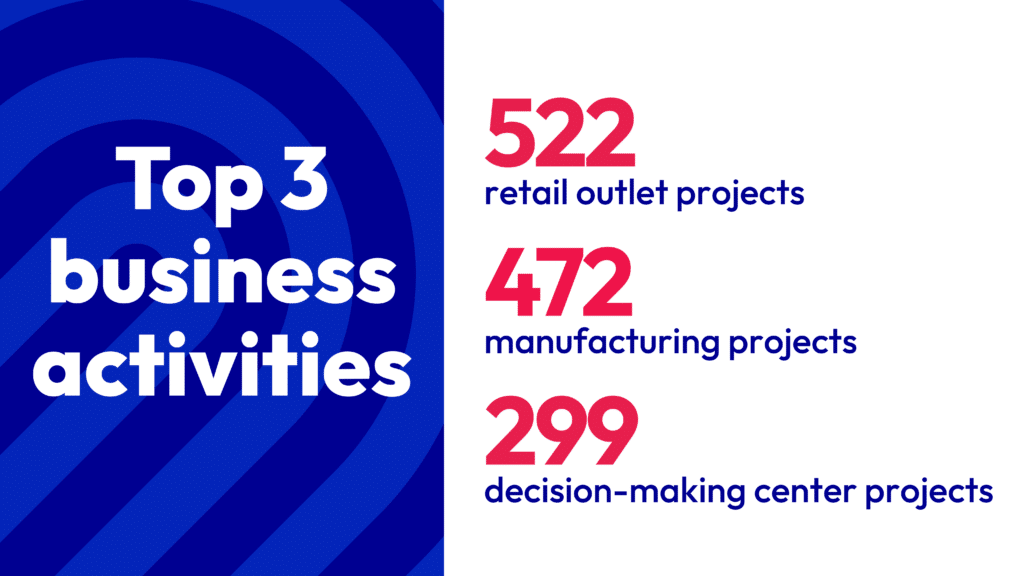
- 472 manufacturing projects, including 13% in the agri-food sector, 11% in the automotive industry and 10% in machinery and mechanical equipment.
- 299 decision-making center projects.
- 522 new retail outlet openings, reflecting the dynamism of the domestic market.
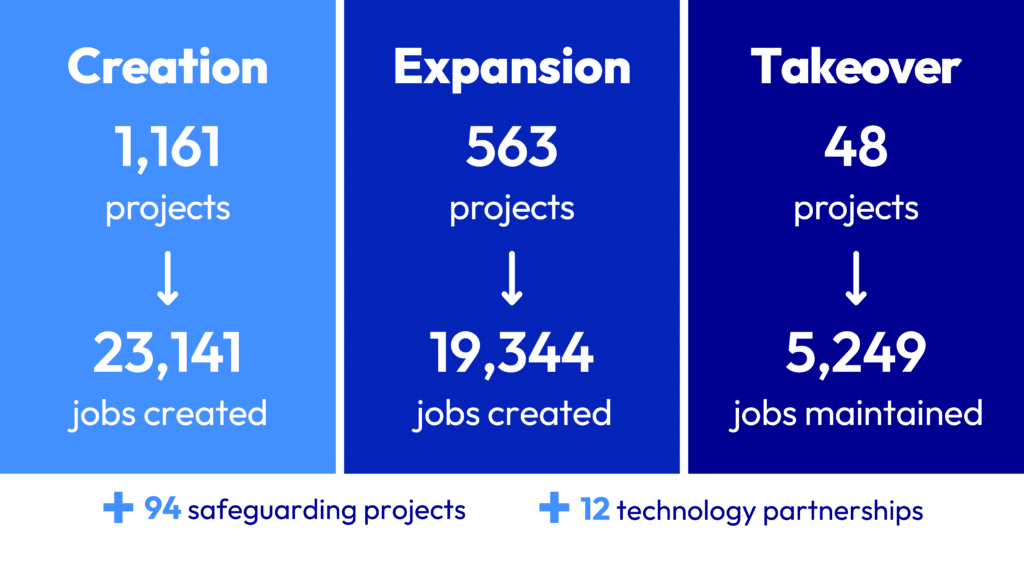
- 48 takeovers of ailing sites, saving 5,249 jobs.
- Nearly 70 decarbonization projects (agrifood, materials, automotive).
- 465 projects contributing to national priorities for innovation and ecological transition.
The source country of foreign businesses that choose France
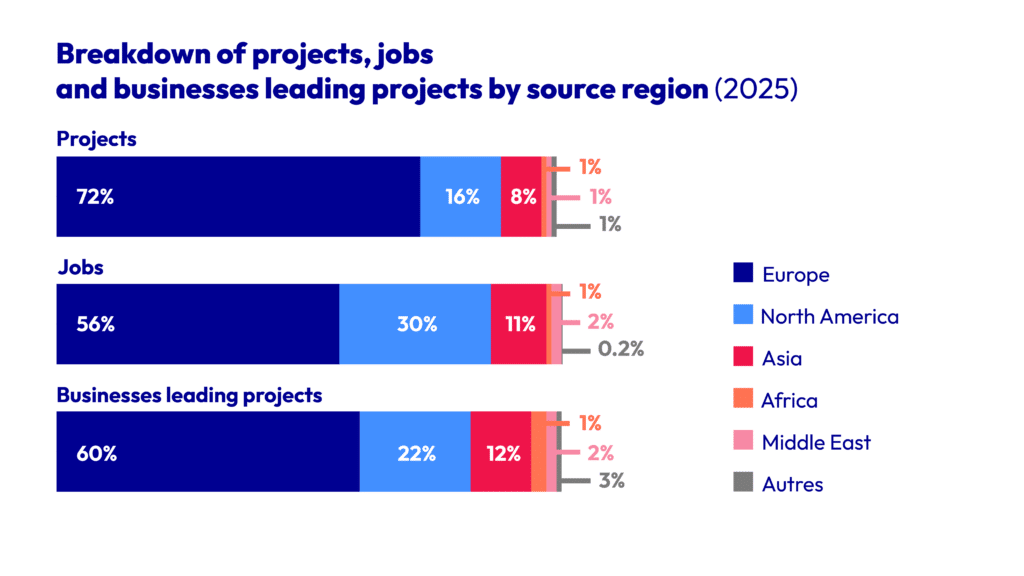
Europe remained the primary source region for investments, with:
- 72% of projects.
- 56% of associated jobs.
It was followed by North America and Asia.
The main investing countries were:
| By number of jobs | By number of projects | By number of companies carrying out projects |
|---|---|---|
| United States | Germany | United States |
| Germany | United States | Germany |
| Italy | United Kingdom | Italy |
| United Kingdom | Italy | United Kingdom |
| China | Belgium | Belgium |
Region benefiting from these investments
The economic attractiveness was evident throughout the entire country:
- 48% of the projects were located in municipalities with fewer than 20,000 inhabitants.
- These investments accounted for 59% of the projected jobs.
- Industry and logistics were the main drivers of this local dynamic.
The dynamics over the last 10 years
Over the past 10 years, the foreign investment in France are :
- 15,231 investment decisions welcomed in France.
- +5% per year on average.
- Over 7,300 businesses have invested in France.
- 429,069 jobs have been created or maintained.
Foreign businesses supported by Business France between 2014 and 2024 made a significant contribution to the country’s commercial dynamism. In 2024, they generated €57.3 billion in exports according to the French Customs Authorities, accounting for nearly 10% of French goods exports.
2024 foreign investment report: 10 years of the French economy’s internationalisation
Business France’s methodoloy
Business France, with the support of its regional partners, counts the investment decisions in France made by foreign businesses.
A firm is considered a foreign business if its operational control country is based abroad and/or the majority of its shares or voting rights are held by a foreign business.
The census method
All foreign investments that create or maintain jobs in France are recorded:
- Creation of sites.
- Expansions.
- Takeovers of ailing sites.
- Sustainability (digitalization, decarbonization, safeguarding).
- R&D partnerships involving a presence in France.
Each project is subject to cross-validation by Business France and regional stakeholders, guaranteeing the reliability and consistency of the data.
The source country is determined according to majority operational control, i.e. the entity exercising the main decision-making power.
Methodological developments in 2025
Two major developments have enhanced the accuracy of the measurement:
- Full accounting of projected jobs : All permanent jobs announced are now counted in as full-time equivalent jobs and not only those expected within three years.
- Detailed inventory of retail outlets : Business openings are counted according to the principle: one opening = one project, at the municipal level and excluding relocations.
These developments improve the measurement of the real economic impact of foreign investments.
France’s position in relation to other European countries
Since 2019, France has been the leading country for foreign investment according to the EY Attractiveness Survey.
In 2025, France recorded 852 projects and was ahead of the United Kingdom (730 projects) and Germany (548 projects).
Keys lessons
- France attracted nearly one in five projects in Europe.
- Industrial projects declined by 28%.
- 28,000 jobs are created by investment projects in 2025.
France was ranked first in Europe for investments in R&D (55 projects).
Methodology
Each year, the EY Attractiveness Survey measures the ability of European countries to attract foreign investment.
The study is based on two complementary pillars:
- The inventory of publicly announced establishment or expansion projects in Europe
- A qualitative survey of a panel of international business leaders
Included are:
- The creation of new activities.
- Significant expansions to existing sites.
Excluded are:
- Purely financial merger and acquisition transactions.
The quantitative data comes from:
- From a European database of investment announcements.
- From various national sources.